


Power BI: bookmarks or pages ?
Create a page is easier than to create a bookmark but the best way to optimize a report, it is the combination of both, of course, depending of my data and the way to present it, I can have only pages and not using any bookmarks. If you are looking to make appear automatically a small window with information, read Power BI: show popup after hovering the mouse. Bookmarks have many advantages but there are 3 main inconvenients:
- Create a button to link each bookmark
- Good management of visuals to hide or unhide them
- Save/update each bookmark for any modifications
In pages, I don’t have to think about those points although I still can use bookmarks. Let´s take an example, I want to create a report showing incident and problem performances:
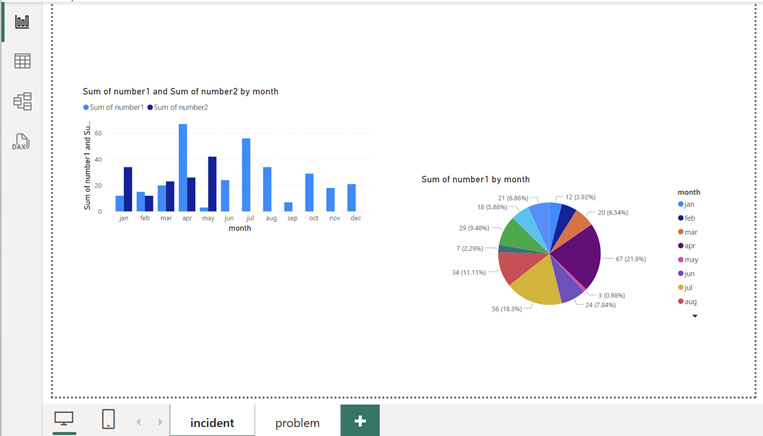
- Option 1, create 2 pages, one for incident and one for problem. In this scenario, I just put my visuals like charts, tables, maps, etc. and I have nothing more to do
NOTE: remember, I still can use bookmarks in this scenario - Option 2, create 1 page with 2 bookmarks, one for incident and one for problem. In this scenario, I have to create 2 buttons for each bookmark:
- For incident, hide all problem visuals and importantly, not forget to save/update the “incident bookmark”
- For problem, hide all incident visuals and importantly, not forget to save/update the “problem bookmark”
Take note that bookmarks can be used for only 1 or more specific visuals. For instance, in “incident” page, I have 3 maps and by default, I want my audience to see only 2 and then they click on a button, the last one will appear. Alternatively, there is another way to do this trick using formula (read Power BI: hide visual and change background color based on selection) but for multiple visuals, the best way to do it is with bookmarks.
Let me show you, pictures are more speaking than words in some situations. For the option 1, I just create 2 pages and put my visuals:
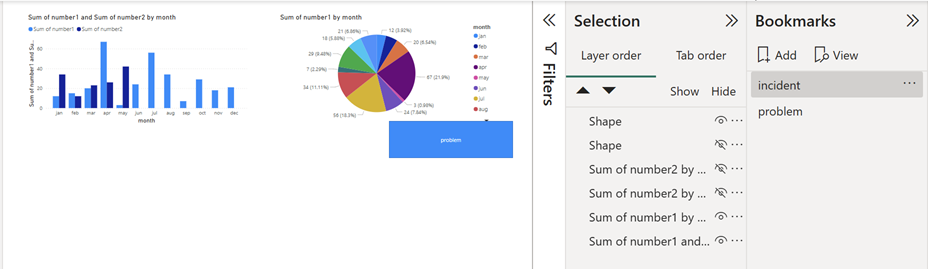
For the option 2, I will put all visuals in one single page:
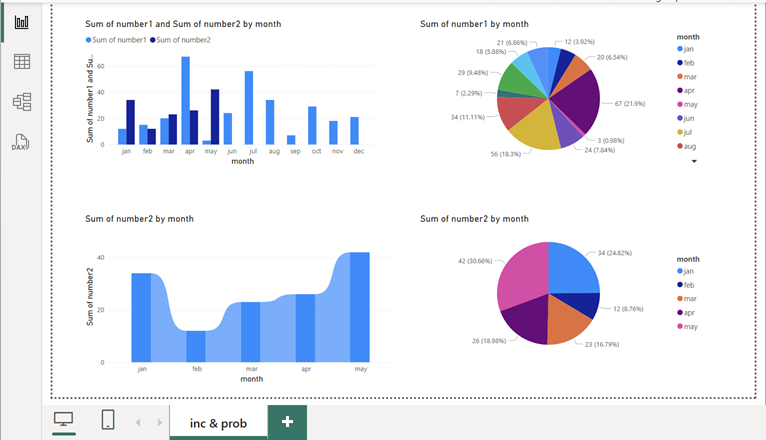
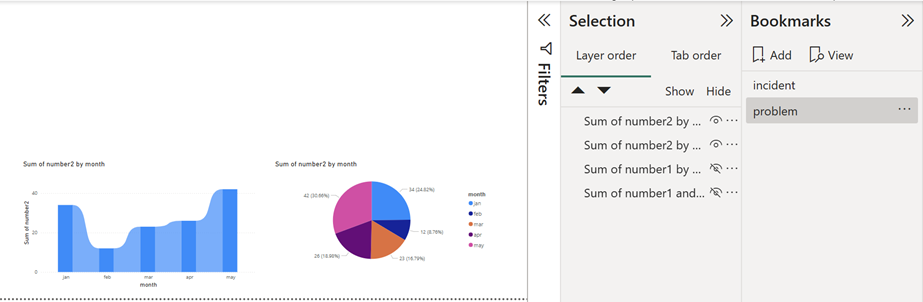
So if I want my audience to see them, I don’t need to use bookmark but imagine that I want them to see only the “incident” (the 2 top) visuals by default and to show the “problem” (the 2 down) visuals only after doing an action, in this case, by clicking on a button.
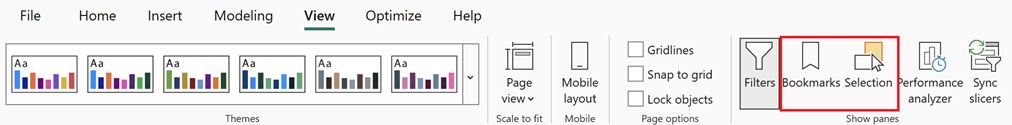
First, I will make appear the “bookmark” and “selection” panels by clicking on “view”:
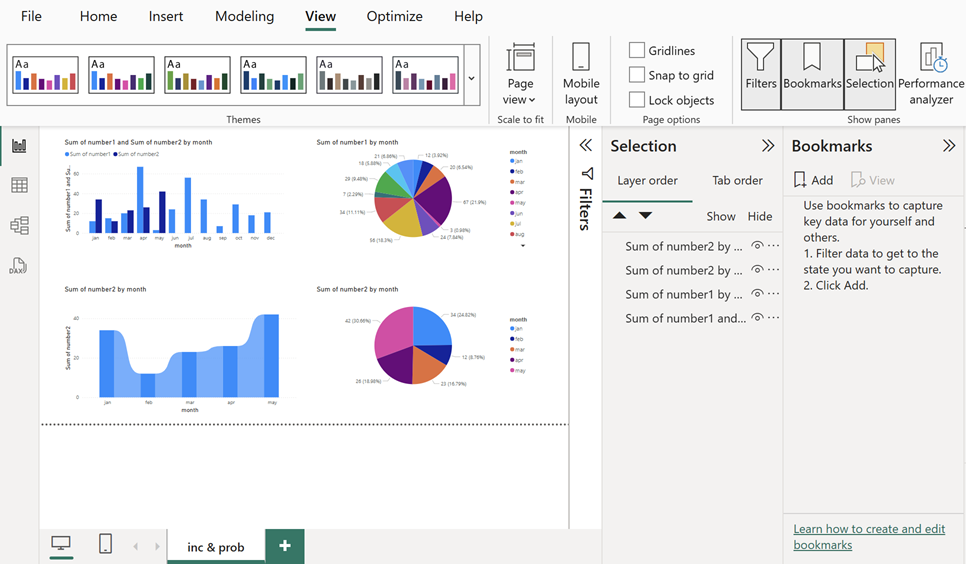
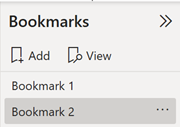
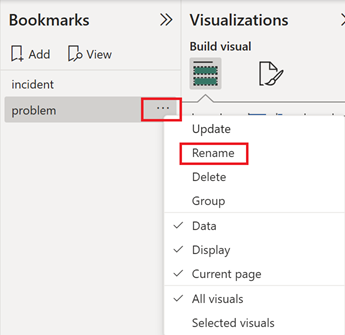
On the “bookmarks” panel, I will click 2 times on “add” (left picture) then I will rename the first one as “incident” and the second one as “problem” by clicking on the “3 dots -> rename” (right picture):
 |
 |
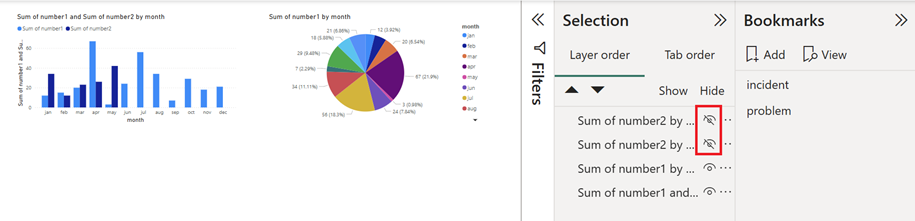
In the “selection” panel, I will hide the “problem” visuals by clicking on the “eye”:
NOTE:
- Bookmarks and visuals can be moved up or down, click on it and move it
- Bookmarks and visuals can be grouped, select some of them then click on the “3 dots” to see the “group” option
In the “bookmarks” panel, for “incident”, click on the “3 dots -> update”:
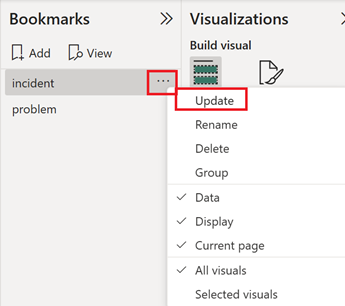
NOTE: if I forget to do that, I will have to repeat the process again. Remember what I said before, for any modifications, I have to click on “update” to save what I did
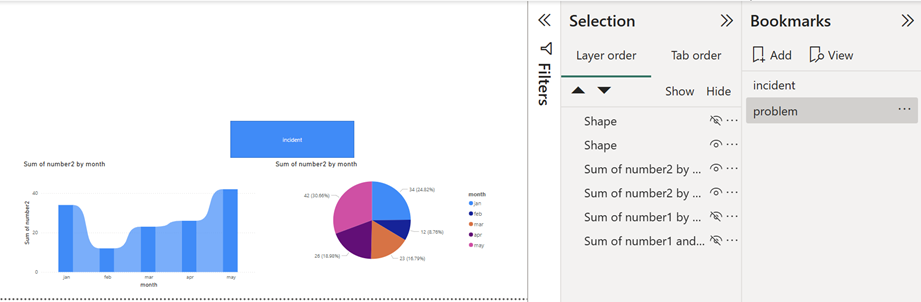
In the “bookmarks” panel, click first on “problem” to show all visuals then hide the “incident” visuals then click on “udpdate”:
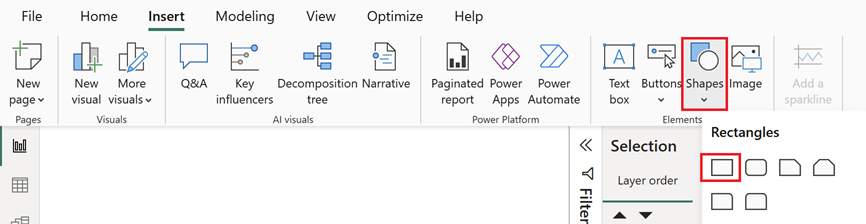
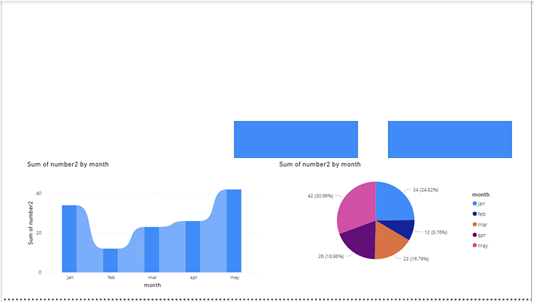
Now in the “bookmarks” panel, if I click on “incident”, I will see only its visuals and if I click on “problem”, I will display only its. As I said above, by default, my audience will see “incident”, for them, to see “problem”, I have to create 2 buttons by clicking on “insert -> shapes”:
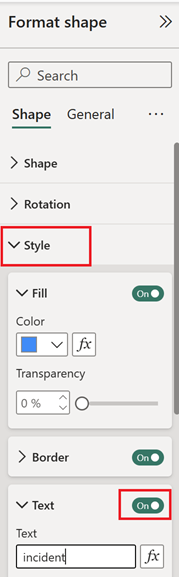
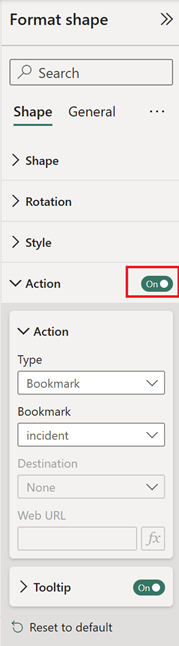
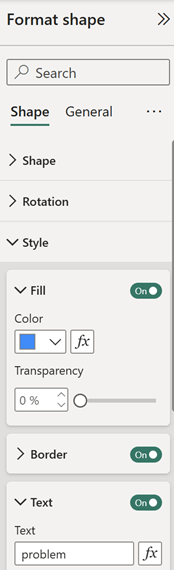
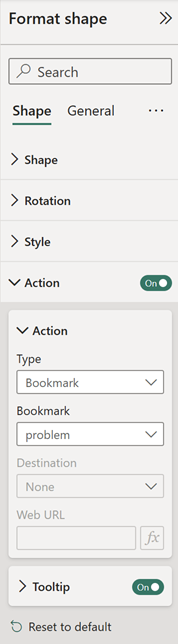
For the first one, in the “format shape” panel, turn on “text” inside “style” then in the “text” field, put “incident” and turn on “action” then on “type”, select “bookmark” and in “bookmark” field, select “incident”. Do the same thing for the second one by naming it “problem” then linked to its bookmark:
 |
 |
 |
 |

Now if I move my mouse in the “incident” button, I will see this message:
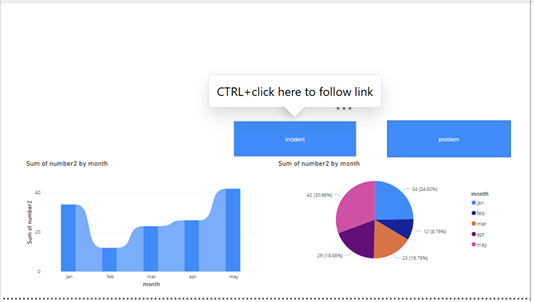
NOTE: once published the report in Power BI Service, only 1 click is enough, the “CTRL” is only in Power BI Desktop
By doing so, I will make appear the “incident” visuals and vise versa for “problem”. Now, let’s go further, I want to hide the “incident” button for the “incident” bookmark so I just have to select it, click on the “eye” in the “selection” panel then click on “update” for the “incident” bookmark:
Doing the same process for “problem”:
Important things to know about bookmark:
- Bookmarks can be used in multiple pages, of course, the same bookmark can’t be used for different pages
- Multiple bookmarks in one single page are more difficult to manage
Explanation of the other options of bookmark:
- By keeping the “data” selected, cross filtering between visuals, visuals sort order, visuals drill downs and filter/slicer selections will be saved in the bookmark
- By keeping the “display” selected, all hidden visuals will be kept hidden
- By keeping the “current page” selected, you will always be redirected to the page where the bookmark has been created
- For the last 2 options, you will have to select one of them:
- Selecting “all visuals”, you will save the configuration of all the visuals as they are. For instance, if I have 1 slicer called “type” with 2 options (open and close) and I select “open” then “update” my bookmark, it will keep my selection as default
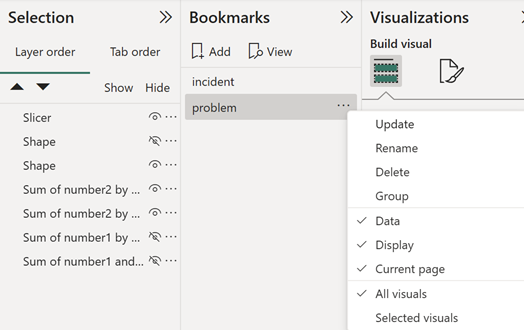
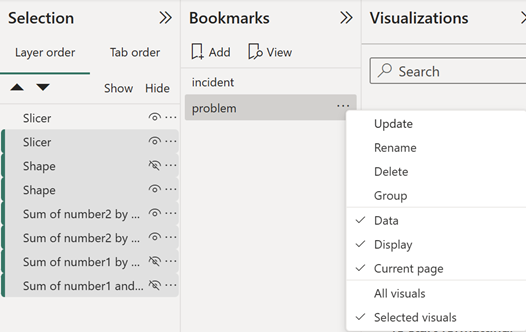
- Selecting “selected visuals”, you will save only the configuration of the selected visuals as they are. For instance, if I have 2 slicers called “type” and “priority” and I select “type” then “update” my bookmark, by switching between bookmarks, “type” will always reset with my default selection meanwhile “priority” will not
- Selecting “all visuals”, you will save the configuration of all the visuals as they are. For instance, if I have 1 slicer called “type” with 2 options (open and close) and I select “open” then “update” my bookmark, it will keep my selection as default
Interesting Topics
-

Be successfully certified ITIL 4 Managing Professional
Study, study and study, I couldn’t be successfully certified without studying it, if you are interested...
-
Be successfully certified ITIL 4 Strategic Leader
With my ITIL 4 Managing Professional certification (ITIL MP) in the pocket, it was time to go for the...
-

Hide visual and change background color based on selection
Some small tricks to customize the background colour of a text box...
-
Stacked and clustered column chart or double stacked column chart
In excel, I use a lot the combination of clustered and stacked chart...
-

Refresh Power BI
From the Power BI Service, I can set refresh but, for instance, there is no option to do it monthly or each time a change is made...
-
Power BI alerts to be sent by email from an excel file based on condition
I will explain how to send a list of emails from an excel file after creating alerts...
-

Count and check empty cells of filtered columns using a macro in an excel report
I use this macro to check if there are blank cells after I filtered...
-
Delete rows out of date using a macro in an excel report
In most of the reports, when I am doing the monthly one, I just need to keep all data that are in the month...
-
Find a specific value then insert a row and more things using a macro in an excel report
This VBA allows me to look for a specific value, it can be...
-
Execute a macro based on the day or time in an excel report
In some excel files, I am using a macro to tell it in which moment to do the report. For instance, if I am...
-
List unique values then combine in one single cell all data using a macro in an excel report
In one of my reports, I have to list from a column the unique values...
-

Copy/paste a range of values after finding the current date in an excel report
This script is to check and compare each cell of a specific column to...
-
Insert a row after finding a specific value in an excel report
This script allows to search a particular value, once find it, a new row will be inserted above or below...
-
Copy data between 2 sheets on top or bottom using an office script in an excel report
This online script allows me to copy the full data of a table to another...
-
Use a script to copy, cut, paste, replace and delete in an excel report (part 2)
This is the second part of my tutorial and it will be focused on...
-
Autofill from the last row using an office script in an excel report
This script will look for the last row then it will copy and paste the data to a number of rows below...
-

Calculate a weighted average for a SLA and a conversation time with a formula in an excel report
In one of my experiences, I had a tool that gave me the weighted average...
-
Search in different sheets then display the wanted data with a formula in an excel report
vlookup and hlookup are formulas that allow to search a data in another...
-
Find the good data by matching 3 different criterias with a formula in an excel report
It is a combination of “index” and “match” formulas, much better...
-
Sum and count sales with a formula in an excel report
Extracting data from salesforce or qlikview may not give the information I needed, it already happened...
Know how long a service is impacted with a formula in an excel report
It is important to know how long the service has been impacted by...