


Power BI: show the chart until the month selection
With a month filter, when I select the months, my column chart will show the data based on the selection. For instance, to show the first 3 months, I have to select on my slicer: January, February and March but what about if I want to select only March and automatically, I want my chart to display the previous months !!!
I have those 2 tables with no relationship:
| Table1 | Table2 |
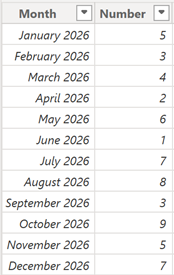 |
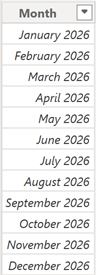 |
I will create a measure with this formula:
IF(MAX('table1'[argument1])<=SELECTEDVALUE('table2'[argument1]),SUM('table1'[argument2]))

I will create my visuals:
- My slicer with the month column of the table2
- My clustered column chart with the month column of the table1 and my measure
For my slicer, I will configure it like that:
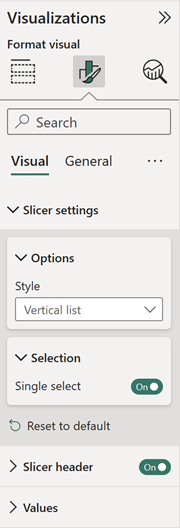
NOTE: in the “style” field, I can also select either as “dropdown” or as “tile”
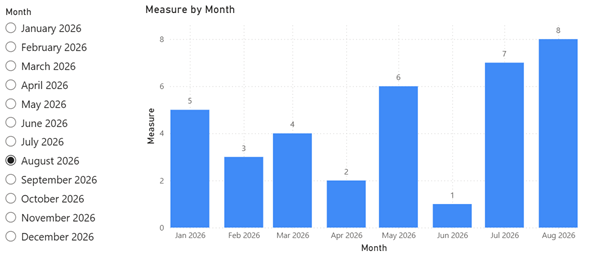
The result:
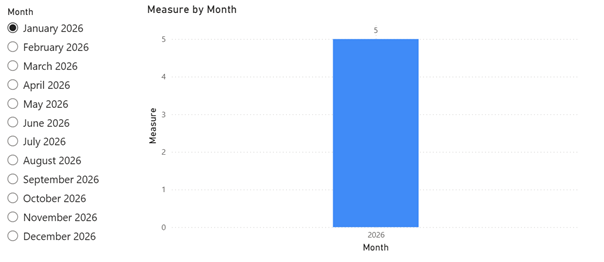
If I select for instance August, automatically, the chart will show all results until the selected month:
Interesting Topics
-

Be successfully certified ITIL 4 Managing Professional
Study, study and study, I couldn’t be successfully certified without studying it, if you are interested...
-
Be successfully certified ITIL 4 Strategic Leader
With my ITIL 4 Managing Professional certification (ITIL MP) in the pocket, it was time to go for the...
-

Hide visual and change background color based on selection
Some small tricks to customize the background colour of a text box...
-
Stacked and clustered column chart or double stacked column chart
In excel, I use a lot the combination of clustered and stacked chart...
-

Refresh Power BI
From the Power BI Service, I can set refresh but, for instance, there is no option to do it monthly or each time a change is made...
-
Power BI alerts to be sent by email from an excel file based on condition
I will explain how to send a list of emails from an excel file after creating alerts...
-

Count and check empty cells of filtered columns using a macro in an excel report
I use this macro to check if there are blank cells after I filtered...
-
Delete rows out of date using a macro in an excel report
In most of the reports, when I am doing the monthly one, I just need to keep all data that are in the month...
-
Find a specific value then insert a row and more things using a macro in an excel report
This VBA allows me to look for a specific value, it can be...
-
Execute a macro based on the day or time in an excel report
In some excel files, I am using a macro to tell it in which moment to do the report. For instance, if I am...
-
List unique values then combine in one single cell all data using a macro in an excel report
In one of my reports, I have to list from a column the unique values...
-

Copy/paste a range of values after finding the current date in an excel report
This script is to check and compare each cell of a specific column to...
-
Insert a row after finding a specific value in an excel report
This script allows to search a particular value, once find it, a new row will be inserted above or below...
-
Copy data between 2 sheets on top or bottom using an office script in an excel report
This online script allows me to copy the full data of a table to another...
-
Use a script to copy, cut, paste, replace and delete in an excel report (part 2)
This is the second part of my tutorial and it will be focused on...
-
Autofill from the last row using an office script in an excel report
This script will look for the last row then it will copy and paste the data to a number of rows below...
-

Calculate a weighted average for a SLA and a conversation time with a formula in an excel report
In one of my experiences, I had a tool that gave me the weighted average...
-
Search in different sheets then display the wanted data with a formula in an excel report
vlookup and hlookup are formulas that allow to search a data in another...
-
Find the good data by matching 3 different criterias with a formula in an excel report
It is a combination of “index” and “match” formulas, much better...
-
Sum and count sales with a formula in an excel report
Extracting data from salesforce or qlikview may not give the information I needed, it already happened...
Know how long a service is impacted with a formula in an excel report
It is important to know how long the service has been impacted by...