


Power BI: calculate values of a single column by row
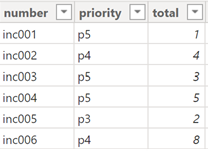
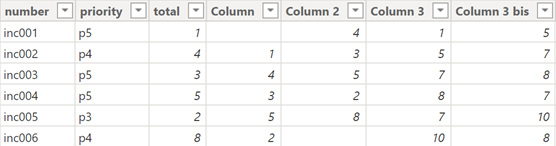
To calculate the values of each row of a single column, I will use the OFFSET and/or WINDOW functions. There are different ways to do it but with those functions, I will use 1 or at least very few formula lines, moreover, with them, I can group the results by category in a simple way. Let´s say that I have this simple data:
I will start first with the OFFSET function and before to explain the calculation, I will explain the basic. OFFSET will display the result one row above or below with this formula:
- One row below: CALCULATE(VALUES('table'[argument1]),OFFSET(-1,,ORDERBY('table'[argument2])),REMOVEFILTERS())

- One row above: CALCULATE(VALUES('table'[argument1]),OFFSET(1,,ORDERBY('table'[argument2])),REMOVEFILTERS())

NOTE:
- Replace “table” and “argument” by yours
- By default, ORDERBY is ascending (ASC), for descending: ORDERBY('table'[argument2],DESC)
- For a second condition of ordering: ORDERBY('table'[argument2],'table'[argument3]) or ORDERBY('table'[argument2],DESC,'table'[argument3],DESC)
- If the OFFSET is using another table, I have to add “ALLSELECTED” or “ALL” like this:
CALCULATE(VALUES('table1'[argument]),OFFSET(-1,ALL('table2'[argument]),ORDERBY('table2'[argument]))
,REMOVEFILTERS())

- The only difference is the “-1” and “1” and this is the result:
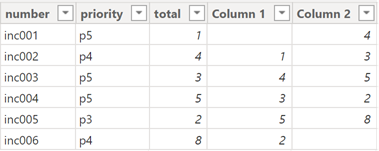
I will use the formula of the column 1 to sum each cell like this:
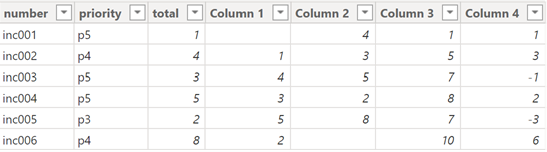
var column1 = CALCULATE(VALUES('table'[argument1]),OFFSET(-1,,ORDERBY('table'[argument2])),REMOVEFILTERS())
RETURN
column1 + CALCULATE(VALUES('table'[argument1])) // to subtract use this (column 4): CALCULATE(VALUES('table'[argument1])) - column1

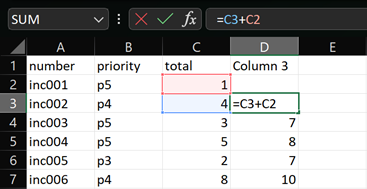
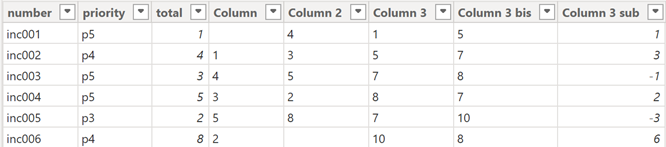
This is the result and the picture on the right, it is just to illustrate easily my meaning:
 |
 |
NOTE:
- For the column 3 and column 5 (below), I can get the same result using the WINDOW function (only measure not column)
- If I prefer to show the total of the result at the first row, I will use this formula:
var column1 = CALCULATE(VALUES('table'[argument1]),OFFSET(-1,,ORDERBY('table'[argument2],DESC)),REMOVEFILTERS())
RETURN
column1 + CALCULATE(VALUES('table'[argument1]))

For a subtraction, this is the formula:
var minvalue = TOPN(1,FILTER('table','table'[argument2]<EARLIER('table'[argument2])),'table'[argument2],DESC)
RETURN
'table'[argument1]-MINX(minvalue,'table'[argument1])

If I want to do the same calculation but only for a category group, I will use the PARTITIONBY sub-function of OFFSET. For instance, I want the result calculated and grouped based on the priority:
var groupcat = CALCULATE(VALUES('table'[argument1]),OFFSET(-1,,ORDERBY('table'[argument2]),,PARTITIONBY('table'[argument3])),REMOVEFILTERS())
RETURN
groupcat + CALCULATE(VALUES('table'[argument1]))

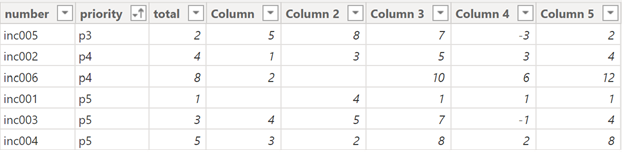
NOTE for a second condition of grouping: PARTITIONBY('table'[argument3],'table'[argument4])
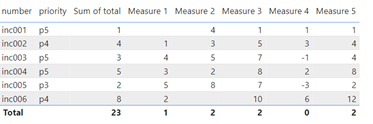
Alternatively, instead to use calculated columns, I can use only measures. The formula will be a little different but quite similar:
- Measure 1 (column 1): CALCULATE(MIN('table'[argument1]),OFFSET(-1,ALL('table'),ORDERBY('table'[argument2])))

NOTE: If the OFFSET is using another table: CALCULATE(MIN('table1'[argument]),OFFSET(-1,ALL('table2'),ORDERBY('table2'[argument])))

NOTE: based on your data, “ALLSELECTED” will work better than “ALL” - Measure 2 (column 2): CALCULATE(MIN('table'[argument1]),OFFSET(1,ALL('table'),ORDERBY('table'[argument2])))
- Measure 3 (column 3):
var measure1 = CALCULATE(MIN('table'[argument1]),OFFSET(-1,ALL('table'),ORDERBY('table'[argument2])))
RETURN
measure1 + CALCULATE(MIN('table'[argument1])) // to subtract use this (measure 4): CALCULATE(MIN('table'[argument1])) - measure1

- Measure 5 (column 5):
var groupcat = CALCULATE(MIN('table'[argument1]),OFFSET(-1,ALL('table'),ORDERBY('table'[argument2]),,PARTITIONBY('table'[argument3])))
RETURN
groupcat + CALCULATE(MIN('table'[argument1]))

Now, I will explain the WINDOW function that can be used only in measure (not in calculated column) for addition only (no subtraction). If you remember, I said that this function can be used to get the same results as the OFFSET for the column/measure 3 and column/measure 5. To have the same thing as the column/measure 3, I will use this formula:
CALCULATE(SUM('table'[argument1]),WINDOW(-1,REL,0,REL,ALL('table'),ORDERBY('table'[argument2])))

And for the column/measure 5:
CALCULATE(SUM('table'[argument1]),WINDOW(-1,REL,0,REL,ALL('table'),ORDERBY('table'[argument2]),,
PARTITIONBY('table'[argument3])))

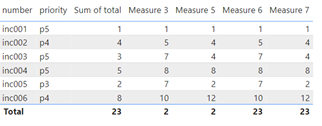
As we can see, with WINDOW, I don’t need to use many calculations as OFFSET to get the same results. Beside that, WINDOW can do more things, I will explain 3 interesting scenarios. For the first one, imagine that I want to show only the sum of the “inc001 + inc002” so I can compare this result with others:
CALCULATE(SUM('table'[argument1]),WINDOW(1,ABS,2,ABS,ALL('table'),ORDERBY('table'[argument2])))

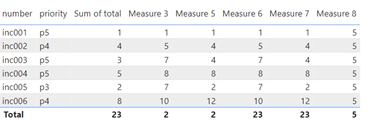
For the second one, I want the total:
CALCULATE(SUM('table'[argument1]),WINDOW(1,ABS,-1,ABS,ALL('table'),ORDERBY('table'[argument2])))

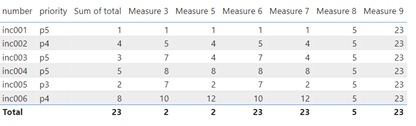
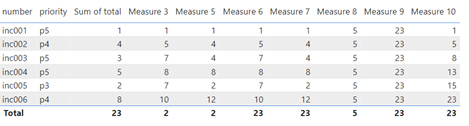
And for the last one, I want a cumulative:
CALCULATE(SUM('table'[argument1]),WINDOW(1,ABS,0,REL,ALL('table'),ORDERBY('table'[argument2])))

NOTE: some functions like ALL, USERELATIONSHIP, etc. work better after the WINDOW function
Alternatively, this article Power BI: calculate values of a single column by cell describes another way to do it by using an index/rank column and if you are interested about the cumulative calculation, read Power BI: cumulative total values.
Interesting Topics
-

Be successfully certified ITIL 4 Managing Professional
Study, study and study, I couldn’t be successfully certified without studying it, if you are interested...
-
Be successfully certified ITIL 4 Strategic Leader
With my ITIL 4 Managing Professional certification (ITIL MP) in the pocket, it was time to go for the...
-

Hide visual and change background color based on selection
Some small tricks to customize the background colour of a text box...
-
Stacked and clustered column chart or double stacked column chart
In excel, I use a lot the combination of clustered and stacked chart...
-

Refresh Power BI
From the Power BI Service, I can set refresh but, for instance, there is no option to do it monthly or each time a change is made...
-
Power BI alerts to be sent by email from an excel file based on condition
I will explain how to send a list of emails from an excel file after creating alerts...
-

Count and check empty cells of filtered columns using a macro in an excel report
I use this macro to check if there are blank cells after I filtered...
-
Delete rows out of date using a macro in an excel report
In most of the reports, when I am doing the monthly one, I just need to keep all data that are in the month...
-
Find a specific value then insert a row and more things using a macro in an excel report
This VBA allows me to look for a specific value, it can be...
-
Execute a macro based on the day or time in an excel report
In some excel files, I am using a macro to tell it in which moment to do the report. For instance, if I am...
-
List unique values then combine in one single cell all data using a macro in an excel report
In one of my reports, I have to list from a column the unique values...
-

Copy/paste a range of values after finding the current date in an excel report
This script is to check and compare each cell of a specific column to...
-
Insert a row after finding a specific value in an excel report
This script allows to search a particular value, once find it, a new row will be inserted above or below...
-
Copy data between 2 sheets on top or bottom using an office script in an excel report
This online script allows me to copy the full data of a table to another...
-
Use a script to copy, cut, paste, replace and delete in an excel report (part 2)
This is the second part of my tutorial and it will be focused on...
-
Autofill from the last row using an office script in an excel report
This script will look for the last row then it will copy and paste the data to a number of rows below...
-

Calculate a weighted average for a SLA and a conversation time with a formula in an excel report
In one of my experiences, I had a tool that gave me the weighted average...
-
Search in different sheets then display the wanted data with a formula in an excel report
vlookup and hlookup are formulas that allow to search a data in another...
-
Find the good data by matching 3 different criterias with a formula in an excel report
It is a combination of “index” and “match” formulas, much better...
-
Sum and count sales with a formula in an excel report
Extracting data from salesforce or qlikview may not give the information I needed, it already happened...
Know how long a service is impacted with a formula in an excel report
It is important to know how long the service has been impacted by...