


Power BI: calculate the average of measures
When I create a visual table and I put my measures with its corresponding value, enabling the “totals” option will not display the correct result. For instance, I have this table:
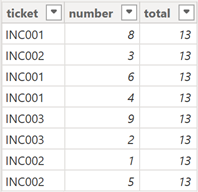
I will create a measure to calculate the percentage for each ticket and I will create the visual table:
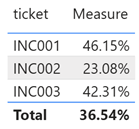
The total line shows 36.54% and this result is not correct because it corresponds to the average of each row or to the sum of all numbers divided by the sum of all total and not the percentage average of the measure:
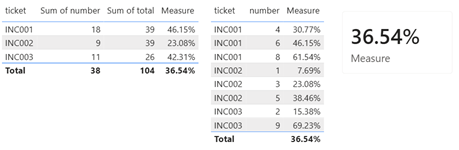
To be sure about it, I will extract the table in excel and do the calculation:
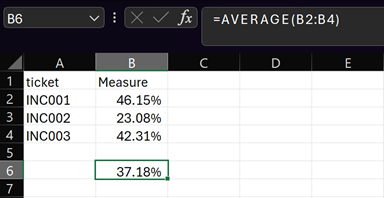
The result is 37.18% so how can I get this same result in Power BI ? I will create another measure with this formula:
AVERAGEX(VALUES('table'[argument]),[measure])

Alternatively, I can use this formula in which I can put multiple conditions if needed:
AVERAGEX(SUMMARIZE('table','table'[argument],"XXX",[measure]),[measure])


The result:
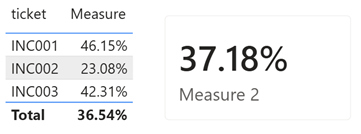
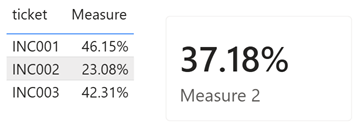
And to not confuse my audience, I will disable the “totals” option:
Interesting Topics
-

Be successfully certified ITIL 4 Managing Professional
Study, study and study, I couldn’t be successfully certified without studying it, if you are interested...
-
Be successfully certified ITIL 4 Strategic Leader
With my ITIL 4 Managing Professional certification (ITIL MP) in the pocket, it was time to go for the...
-

Hide visual and change background color based on selection
Some small tricks to customize the background colour of a text box...
-
Stacked and clustered column chart or double stacked column chart
In excel, I use a lot the combination of clustered and stacked chart...
-

Refresh Power BI
From the Power BI Service, I can set refresh but, for instance, there is no option to do it monthly or each time a change is made...
-
Power BI alerts to be sent by email from an excel file based on condition
I will explain how to send a list of emails from an excel file after creating alerts...
-

Count and check empty cells of filtered columns using a macro in an excel report
I use this macro to check if there are blank cells after I filtered...
-
Delete rows out of date using a macro in an excel report
In most of the reports, when I am doing the monthly one, I just need to keep all data that are in the month...
-
Find a specific value then insert a row and more things using a macro in an excel report
This VBA allows me to look for a specific value, it can be...
-
Execute a macro based on the day or time in an excel report
In some excel files, I am using a macro to tell it in which moment to do the report. For instance, if I am...
-
List unique values then combine in one single cell all data using a macro in an excel report
In one of my reports, I have to list from a column the unique values...
-

Copy/paste a range of values after finding the current date in an excel report
This script is to check and compare each cell of a specific column to...
-
Insert a row after finding a specific value in an excel report
This script allows to search a particular value, once find it, a new row will be inserted above or below...
-
Copy data between 2 sheets on top or bottom using an office script in an excel report
This online script allows me to copy the full data of a table to another...
-
Use a script to copy, cut, paste, replace and delete in an excel report (part 2)
This is the second part of my tutorial and it will be focused on...
-
Autofill from the last row using an office script in an excel report
This script will look for the last row then it will copy and paste the data to a number of rows below...
-

Calculate a weighted average for a SLA and a conversation time with a formula in an excel report
In one of my experiences, I had a tool that gave me the weighted average...
-
Search in different sheets then display the wanted data with a formula in an excel report
vlookup and hlookup are formulas that allow to search a data in another...
-
Find the good data by matching 3 different criterias with a formula in an excel report
It is a combination of “index” and “match” formulas, much better...
-
Sum and count sales with a formula in an excel report
Extracting data from salesforce or qlikview may not give the information I needed, it already happened...
Know how long a service is impacted with a formula in an excel report
It is important to know how long the service has been impacted by...